
9 Platforms That Show You a Business Snapshot in One Click
Running a business means juggling dozens of moving parts at once. You need to track sales, monitor customer activity, watch expenses, and keep an eye on your team’s progress. The last thing you need is to spend hours digging through different systems just to understand how your business is performing. That’s where snapshot platforms come in. These tools pull together your most important data and present it in a single, digestible view. Whether you’re managing a small startup or a growing company, these platforms help you make faster decisions without the headache of manual reporting. Here are nine platforms that give you a complete business overview with just one click.
- Legiit
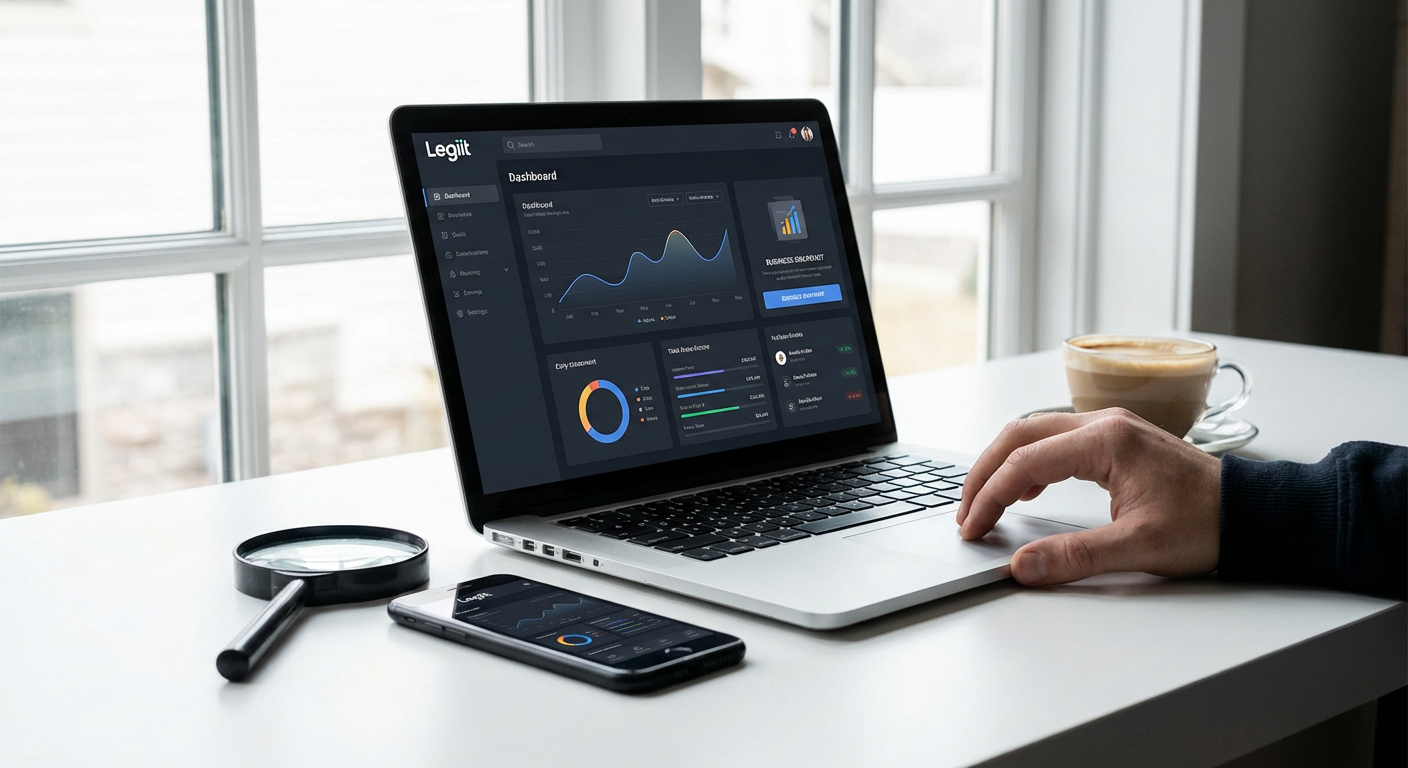
If you run a service-based business or work with freelancers regularly, Legiit offers a clean dashboard that shows you exactly where your projects stand. You can see active orders, completed work, revenue trends, and team performance all in one place.
The platform is built specifically for businesses that rely on digital services, so the snapshot view focuses on what matters most in that context. You can quickly identify which services are selling well, which freelancers are delivering on time, and where your revenue is coming from. This makes it much easier to scale your operations without losing track of the details. The interface is straightforward and doesn’t require a steep learning curve, which means you can start using it productively right away.
- Zoho Analytics
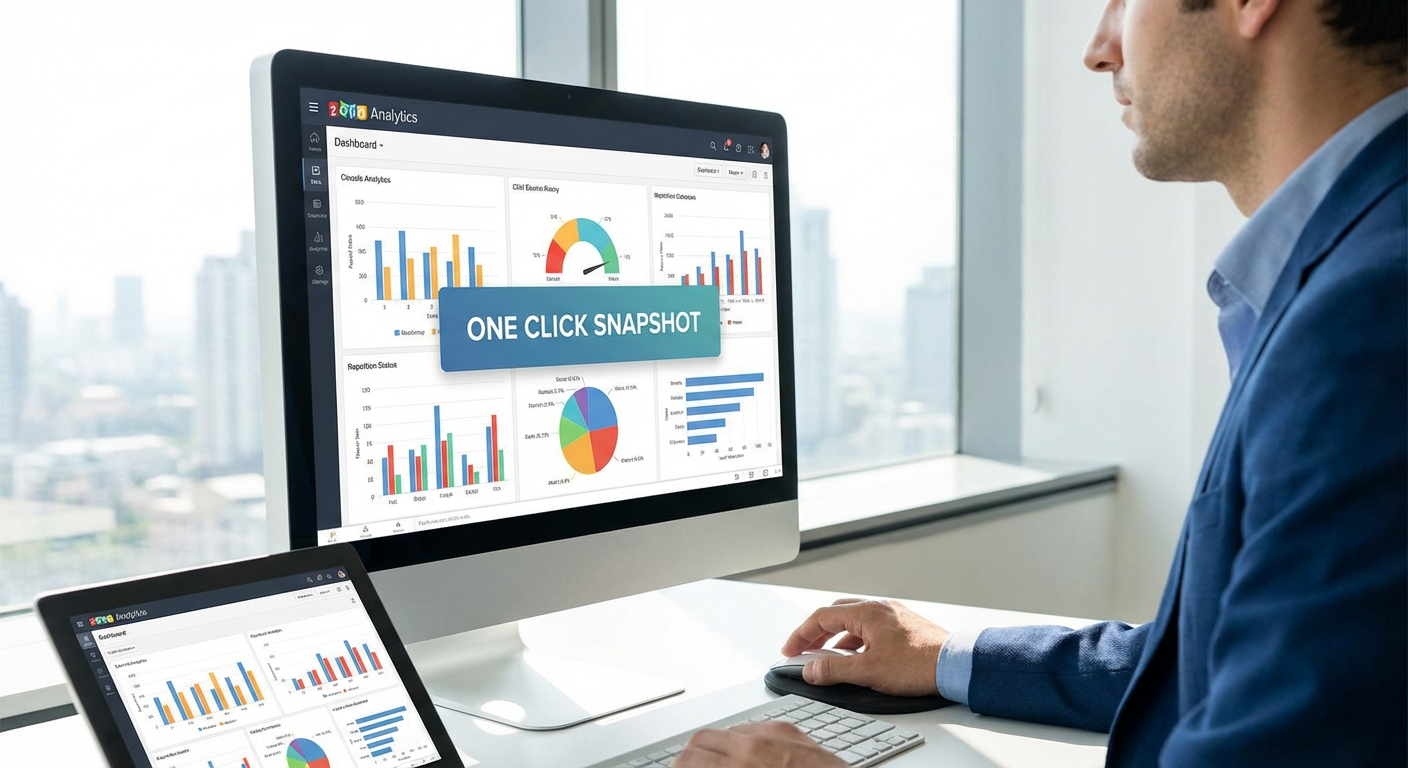
Zoho Analytics pulls data from multiple sources and displays it in a unified dashboard that updates automatically. You can connect your CRM, accounting software, email marketing tools, and more to get a complete picture of your business health.
What sets this platform apart is its flexibility. You can customize your snapshot to show exactly the metrics that matter to your specific business model. Whether you care more about customer acquisition costs, monthly recurring revenue, or inventory levels, you can configure your view accordingly. The drag-and-drop interface makes it simple to rearrange widgets and charts until you have a layout that makes sense for your daily workflow. Reports can be scheduled to arrive in your inbox, so you don’t even need to log in to stay informed.
- Klipfolio
Klipfolio specializes in real-time business dashboards that update as your data changes. This means you’re always looking at current information rather than yesterday’s numbers.
The platform connects to over 400 data sources, so you can pull in information from practically any tool you’re already using. Marketing teams particularly appreciate how quickly they can see campaign performance across multiple channels without switching between tabs. Sales leaders use it to monitor pipeline health and conversion rates at a glance. The mobile app is well-designed, which means you can check your business snapshot from anywhere without being tied to your desk. Setup does require some initial configuration, but once you’ve built your dashboard, maintaining it is minimal work.
- Geckoboard
Geckoboard focuses on simplicity and visual clarity. The platform is designed to be displayed on office screens or accessed quickly on mobile devices, giving you and your team instant visibility into key performance indicators.
Each dashboard is built around clear, easy-to-read visualizations that don’t require interpretation. Numbers are big, charts are simple, and the color coding makes it obvious when something needs attention. This approach works particularly well for teams that need to stay aligned on goals without holding frequent status meetings. You can set up multiple dashboards for different departments or objectives, and switching between them takes just a click. The platform integrates with popular business tools like Salesforce, Google Analytics, and Stripe, making data collection automatic.
- Cyfe
Cyfe offers an all-in-one dashboard that brings together marketing, sales, finance, and operations data in a single view. The platform is particularly popular with small to medium-sized businesses that need comprehensive visibility without enterprise-level complexity.
You can monitor website traffic, social media engagement, email campaign results, and financial metrics side by side. This holistic view makes it easier to spot connections between different parts of your business. For example, you might notice that a spike in social media activity correlates with increased sales, helping you understand which marketing efforts actually drive revenue. The platform includes pre-built widgets for common metrics, so you don’t need to be a data analyst to set up a useful dashboard. White-label options are available if you need to share reports with clients under your own branding.
- Grow
Grow is built for businesses that need powerful data analysis without requiring a technical team to manage it. The platform connects to hundreds of data sources and provides instant visualizations that help you understand trends and patterns.
What makes Grow particularly useful is its focus on collaborative decision-making. You can share dashboards with team members, add comments to specific metrics, and create alerts that notify relevant people when numbers cross certain thresholds. This keeps everyone informed without requiring constant check-ins or status reports. The mobile experience is smooth, so executives can review business performance during their commute or between meetings. Grow also includes forecasting tools that help you project future performance based on historical data, which is valuable for planning and budgeting.
- Databox
Databox specializes in mobile-first business reporting, which makes it perfect for busy professionals who need to stay informed on the go. The platform sends you daily or weekly snapshot reports via mobile notification, so you can review key metrics without even opening an app.
The setup process is guided and intuitive. You select the data sources you want to track, choose the metrics that matter most, and Databox builds a dashboard automatically. From there, you can refine and customize as needed. The platform includes goal-tracking features that let you set targets and monitor progress visually. Many users appreciate the benchmarking capabilities, which compare your performance to industry standards and help you understand whether your numbers are competitive. Databox works well for agencies managing multiple client accounts, since you can create separate dashboards for each client and switch between them easily.
- Supermetrics
Supermetrics takes a different approach by pulling all your marketing data into familiar tools like Google Sheets, Excel, or Google Data Studio. This means you can build custom snapshots using software you already know how to use.
The platform excels at consolidating data from advertising platforms, social media channels, and analytics tools. If you run campaigns across Google Ads, Facebook, LinkedIn, and other channels, Supermetrics automatically pulls performance data into a single report. This saves hours of manual copying and pasting while reducing the risk of errors. You can set up automated reports that refresh on a schedule, so your snapshot is always current. The approach is particularly valuable for businesses that have already invested time in building custom spreadsheet models or data studio templates. Instead of learning a new dashboard tool, you can enhance your existing workflow with better data integration.
- Sisense
Sisense is designed for businesses that work with large amounts of complex data and need powerful analysis capabilities alongside simple visualization. The platform can handle data from warehouses, databases, and cloud applications, processing millions of rows quickly.
Despite its technical power, Sisense provides clean, accessible dashboards that non-technical users can understand. You can drill down into specific metrics when you need more detail, or stay at the high level for a quick snapshot. The platform includes AI-powered insights that automatically flag unusual patterns or significant changes in your data, which helps you catch problems or opportunities you might otherwise miss. Sisense works well for companies in industries like e-commerce, healthcare, and finance where data volume and complexity can overwhelm simpler tools. The platform supports embedded analytics, so you can incorporate dashboard views directly into your own applications or customer portals.
Having instant access to your business metrics changes how you operate. Instead of waiting for weekly reports or digging through multiple systems, you can make informed decisions in real time. The platforms on this list each offer different strengths, so the right choice depends on your specific needs, budget, and technical comfort level. Some focus on simplicity and speed, while others provide deep analytical capabilities. What they all have in common is the ability to save you time and give you confidence in your business decisions. Try out a few options to see which interface feels most natural and which data connections matter most for your particular situation. Once you have a solid snapshot system in place, you’ll wonder how you ever managed without it.