
9 Analytics Dashboards That Help Small Teams Track Marketing KPIs Without Losing Their Minds
Marketing teams, especially smaller ones, face a constant challenge. You need to track performance across multiple channels, prove your value to stakeholders, and make smart decisions based on data. But many analytics tools are built for enterprise teams with dedicated data analysts and massive budgets. This list focuses on dashboards that work well for lean marketing teams who need to monitor their KPIs without drowning in complexity or cost. Whether you’re tracking social media engagement, email performance, or overall campaign ROI, these options can help you stay informed and agile.
- Legiit
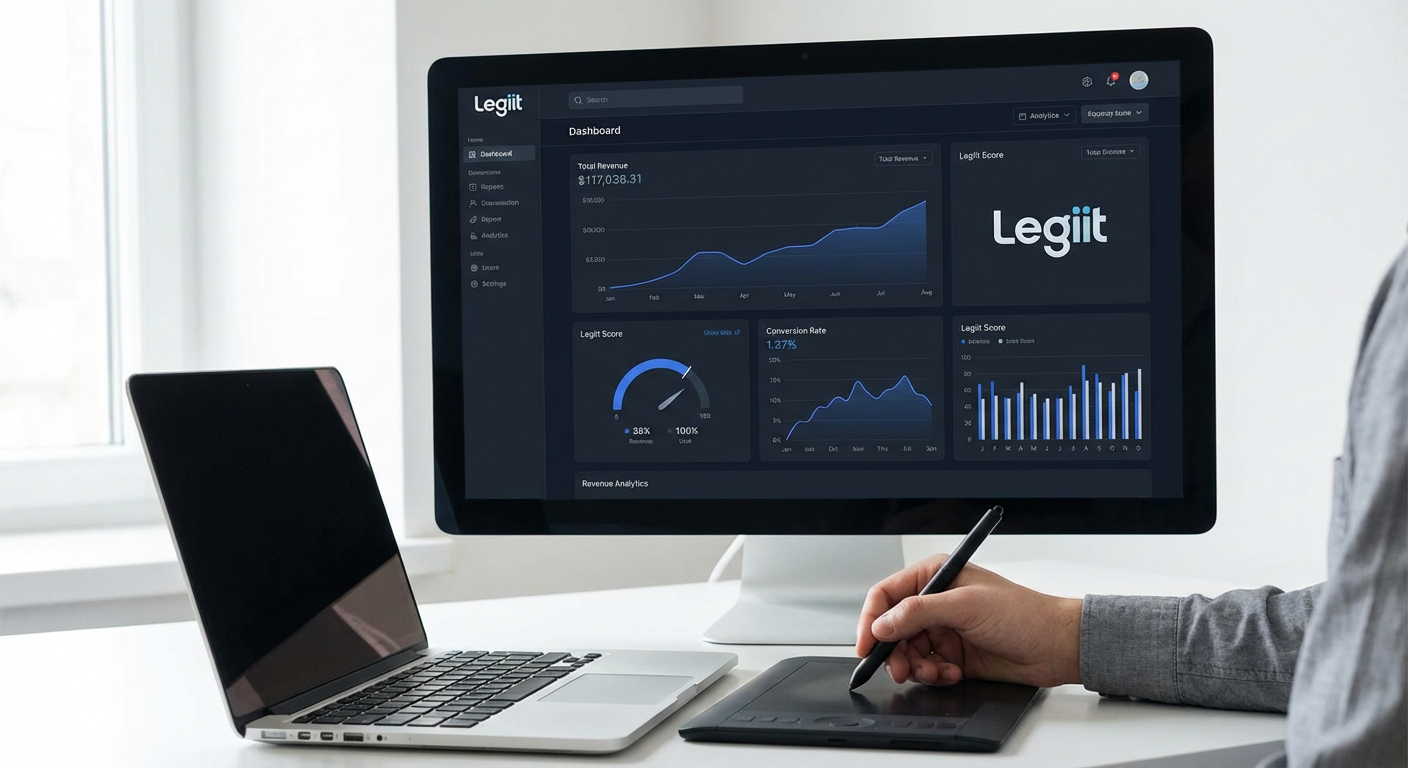
If you’re a small business or agency that needs custom dashboard solutions but doesn’t have an in-house developer, Legiit connects you with freelance specialists who can build exactly what you need. The platform hosts thousands of service providers who specialize in marketing analytics, data visualization, and dashboard creation across tools like Google Data Studio, Tableau, and custom solutions.
What makes this particularly useful is that you can find someone to integrate multiple data sources into a single view, tailored to your specific KPIs. Instead of trying to force-fit your needs into a pre-made template, you work with someone who understands your business goals and creates a dashboard that actually answers your questions. The service marketplace model means you can compare providers, read reviews, and find someone within your budget range.
- Cyfe
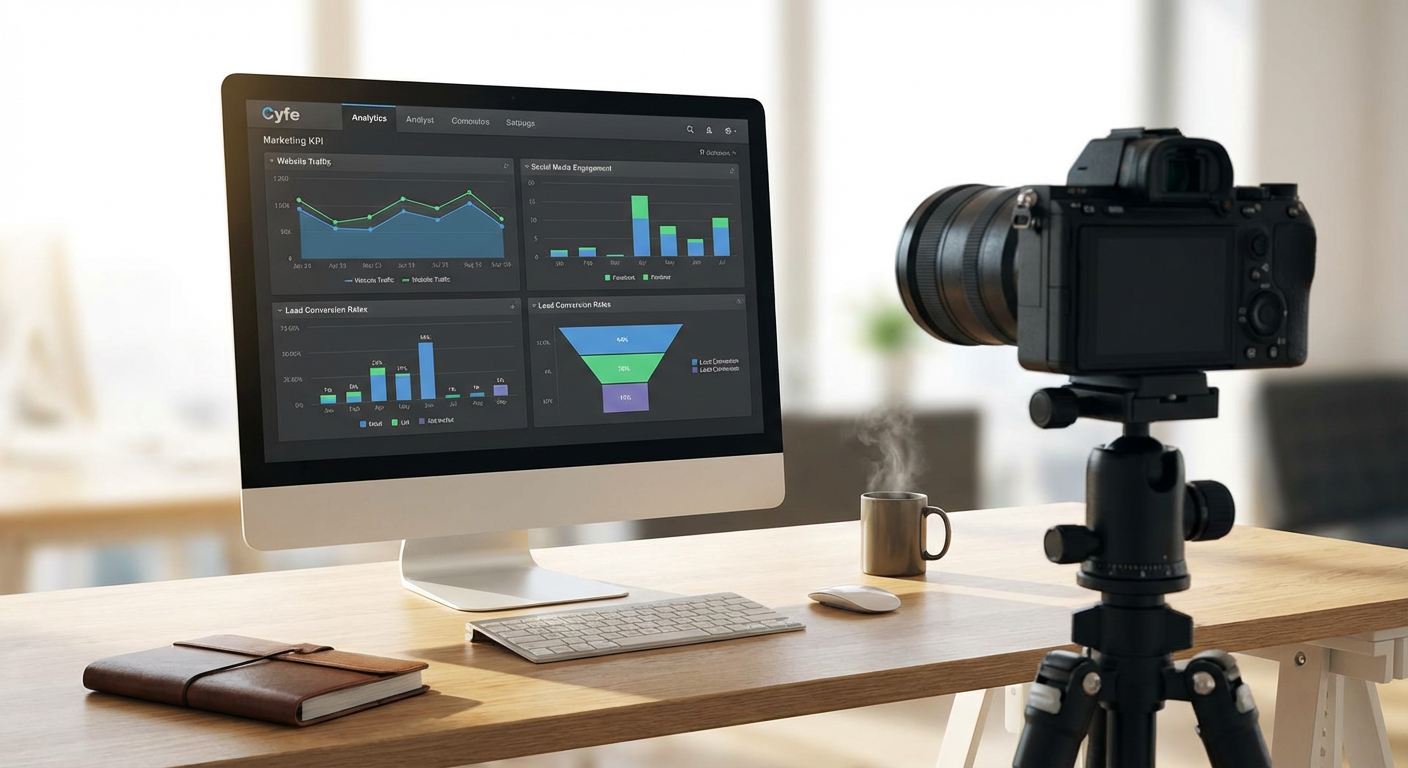
Cyfe takes a widget-based approach that lets you pull data from dozens of sources into one unified view. You can monitor website analytics, social media metrics, email campaign performance, and advertising data all in the same place. The interface feels straightforward, with drag-and-drop functionality that doesn’t require technical knowledge.
The tool shines when you need to create multiple dashboards for different purposes. You might have one for your weekly team meeting, another for monthly executive reports, and a third for monitoring real-time campaign performance. Pre-built widgets connect to popular platforms like Google Analytics, Facebook Ads, and Mailchimp, so setup takes minutes instead of hours. The white-label option also works well if you’re an agency presenting reports to clients.
- Klipfolio
Klipfolio gives you more control over how your data appears and interacts. While it has a steeper learning curve than some alternatives, that complexity translates into flexibility. You can create custom metrics, apply formulas to raw data, and build visualizations that match your exact reporting needs.
This dashboard works particularly well for teams that pull data from less common sources or need to combine metrics in specific ways. The Klip Gallery offers hundreds of pre-built dashboard templates you can use as starting points, then modify to fit your situation. If your marketing KPIs go beyond standard metrics and you need calculations like customer acquisition cost by channel or lifetime value ratios, Klipfolio gives you the tools to build those views yourself.
- Geckoboard
Geckoboard focuses on simplicity and real-time visibility. The dashboards are designed to be displayed on office screens or monitored throughout the day, with large, clear visualizations that everyone can understand at a glance. This makes it ideal for teams that want their KPIs visible and present, not buried in a tool someone checks once a week.
The platform connects to over 80 data sources and emphasizes getting your first dashboard up and running quickly. You won’t find endless customization options here, but that’s the point. Geckoboard helps you avoid analysis paralysis by keeping things clean and focused. If your goal is to keep your team aligned around a few key metrics and build a data-aware culture, this stripped-down approach often works better than feature-heavy alternatives.
- Databox
Databox combines dashboard functionality with mobile accessibility and goal tracking features. You can set targets for each KPI and monitor progress toward those goals, which adds a layer of accountability beyond just viewing numbers. The mobile app means you can check performance from anywhere, which matters when you’re managing campaigns that don’t respect business hours.
The tool includes a feature called Databoards that lets you build custom reports combining metrics from different sources. You might track paid ad performance alongside organic social growth and email list expansion to get a complete picture of your acquisition efforts. Databox also offers automated reporting, so you can schedule weekly or monthly snapshots to be delivered to stakeholders without manually pulling the data each time.
- DashThis
DashThis specializes in marketing reporting specifically, which means the integrations and templates are built with common marketing KPIs in mind. The tool connects easily to platforms like Google Ads, Facebook, Instagram, LinkedIn, and email marketing services. You can create a comprehensive marketing dashboard in under an hour, even if you’ve never used the tool before.
The automated reporting feature saves significant time for agencies or teams that need to produce regular reports. You can set up a template once, and DashThis will populate it with fresh data on your chosen schedule. The reports look clean and client-ready without additional formatting work. For teams that spend too much time copying and pasting data into PowerPoint or Google Slides, this automation alone justifies the cost.
- Whatagraph
Whatagraph takes a visual-first approach to marketing reporting. The platform automatically transforms your data into clean, appealing charts and graphs that communicate performance clearly. This matters when you’re presenting to non-technical stakeholders who need to understand results without wading through spreadsheets.
The tool works particularly well for social media and paid advertising KPIs. You can connect multiple ad accounts and social profiles, then create reports that show performance across all channels in a consistent format. Whatagraph also includes cross-channel reporting features that let you compare performance between platforms, helping you identify where to shift budget or focus. The template library covers most common marketing scenarios, so you’re rarely building reports from scratch.
- Google Looker Studio
Formerly known as Data Studio, Looker Studio is Google’s free dashboard and reporting tool. It connects naturally to other Google products like Analytics, Ads, and Search Console, but also supports hundreds of third-party connectors through its partner network. For teams already invested in the Google ecosystem, this integration depth is hard to beat.
The learning curve sits somewhere in the middle. You can create basic reports quickly using templates, but you also have access to advanced features like calculated fields, data blending, and custom visualizations when you need them. Because it’s free, Looker Studio works well for testing dashboard approaches before committing to a paid tool. The sharing and collaboration features mirror Google Docs, so team members can view, comment on, or edit dashboards based on their permission level.
- AgencyAnalytics
Built specifically for marketing agencies, AgencyAnalytics handles the unique challenge of managing KPIs across multiple clients. Each client gets their own dashboard, and you can set up automated reporting that sends updates directly to clients on your chosen schedule. The white-label features let you brand everything with your agency logo and colors.
The platform includes over 60 marketing integrations covering SEO, PPC, social media, email, and call tracking. One particularly useful feature is the SEO toolkit, which combines rank tracking, site audits, and backlink monitoring alongside your other marketing metrics. This consolidated view helps you report on both paid and organic efforts without switching between tools. The client access portal also reduces the number of status update emails you need to send, since clients can log in and check their dashboards whenever they want.
Tracking marketing KPIs doesn’t have to mean wrestling with complicated software or spending hours each week compiling reports. The right dashboard turns your data into clear insights that actually inform your decisions. Some of these tools prioritize simplicity and speed, while others offer deeper customization for specific needs. Think about your team size, technical comfort level, and reporting requirements when making your choice. The best dashboard is the one you’ll actually use consistently, not the one with the most features. Start with one or two key metrics that matter most to your business, get those tracking smoothly, and expand from there as you build confidence.